Revised First Model (Lab 2)
9/24/2019
This model measures the distance, direction (degrees), and orientation (NSEW) of a polygon(s) from a central point or polygon. Download the model: Distance_Direction_Orientation_from_Center
I used this model to analyze data from the Houston 2017 census on Median gross rent. This census data was collected from the
Texas B25064 and B03002 tables in the 2017 ACS 5-year estimates topic on American FactFinder.
The census tracts data for Texas was found here. The data I use is comprised of the Texas districts that I selected to make up the greater Houston area. After
selecting the districts of interest, I joined the data columns I joined the census data to the census tract geographies. Find all
of the data I used in one concise place right here!.
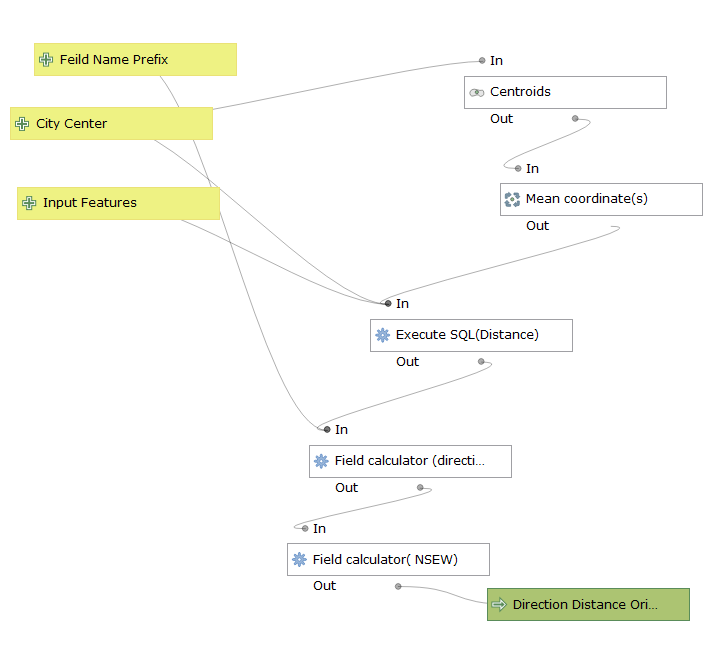
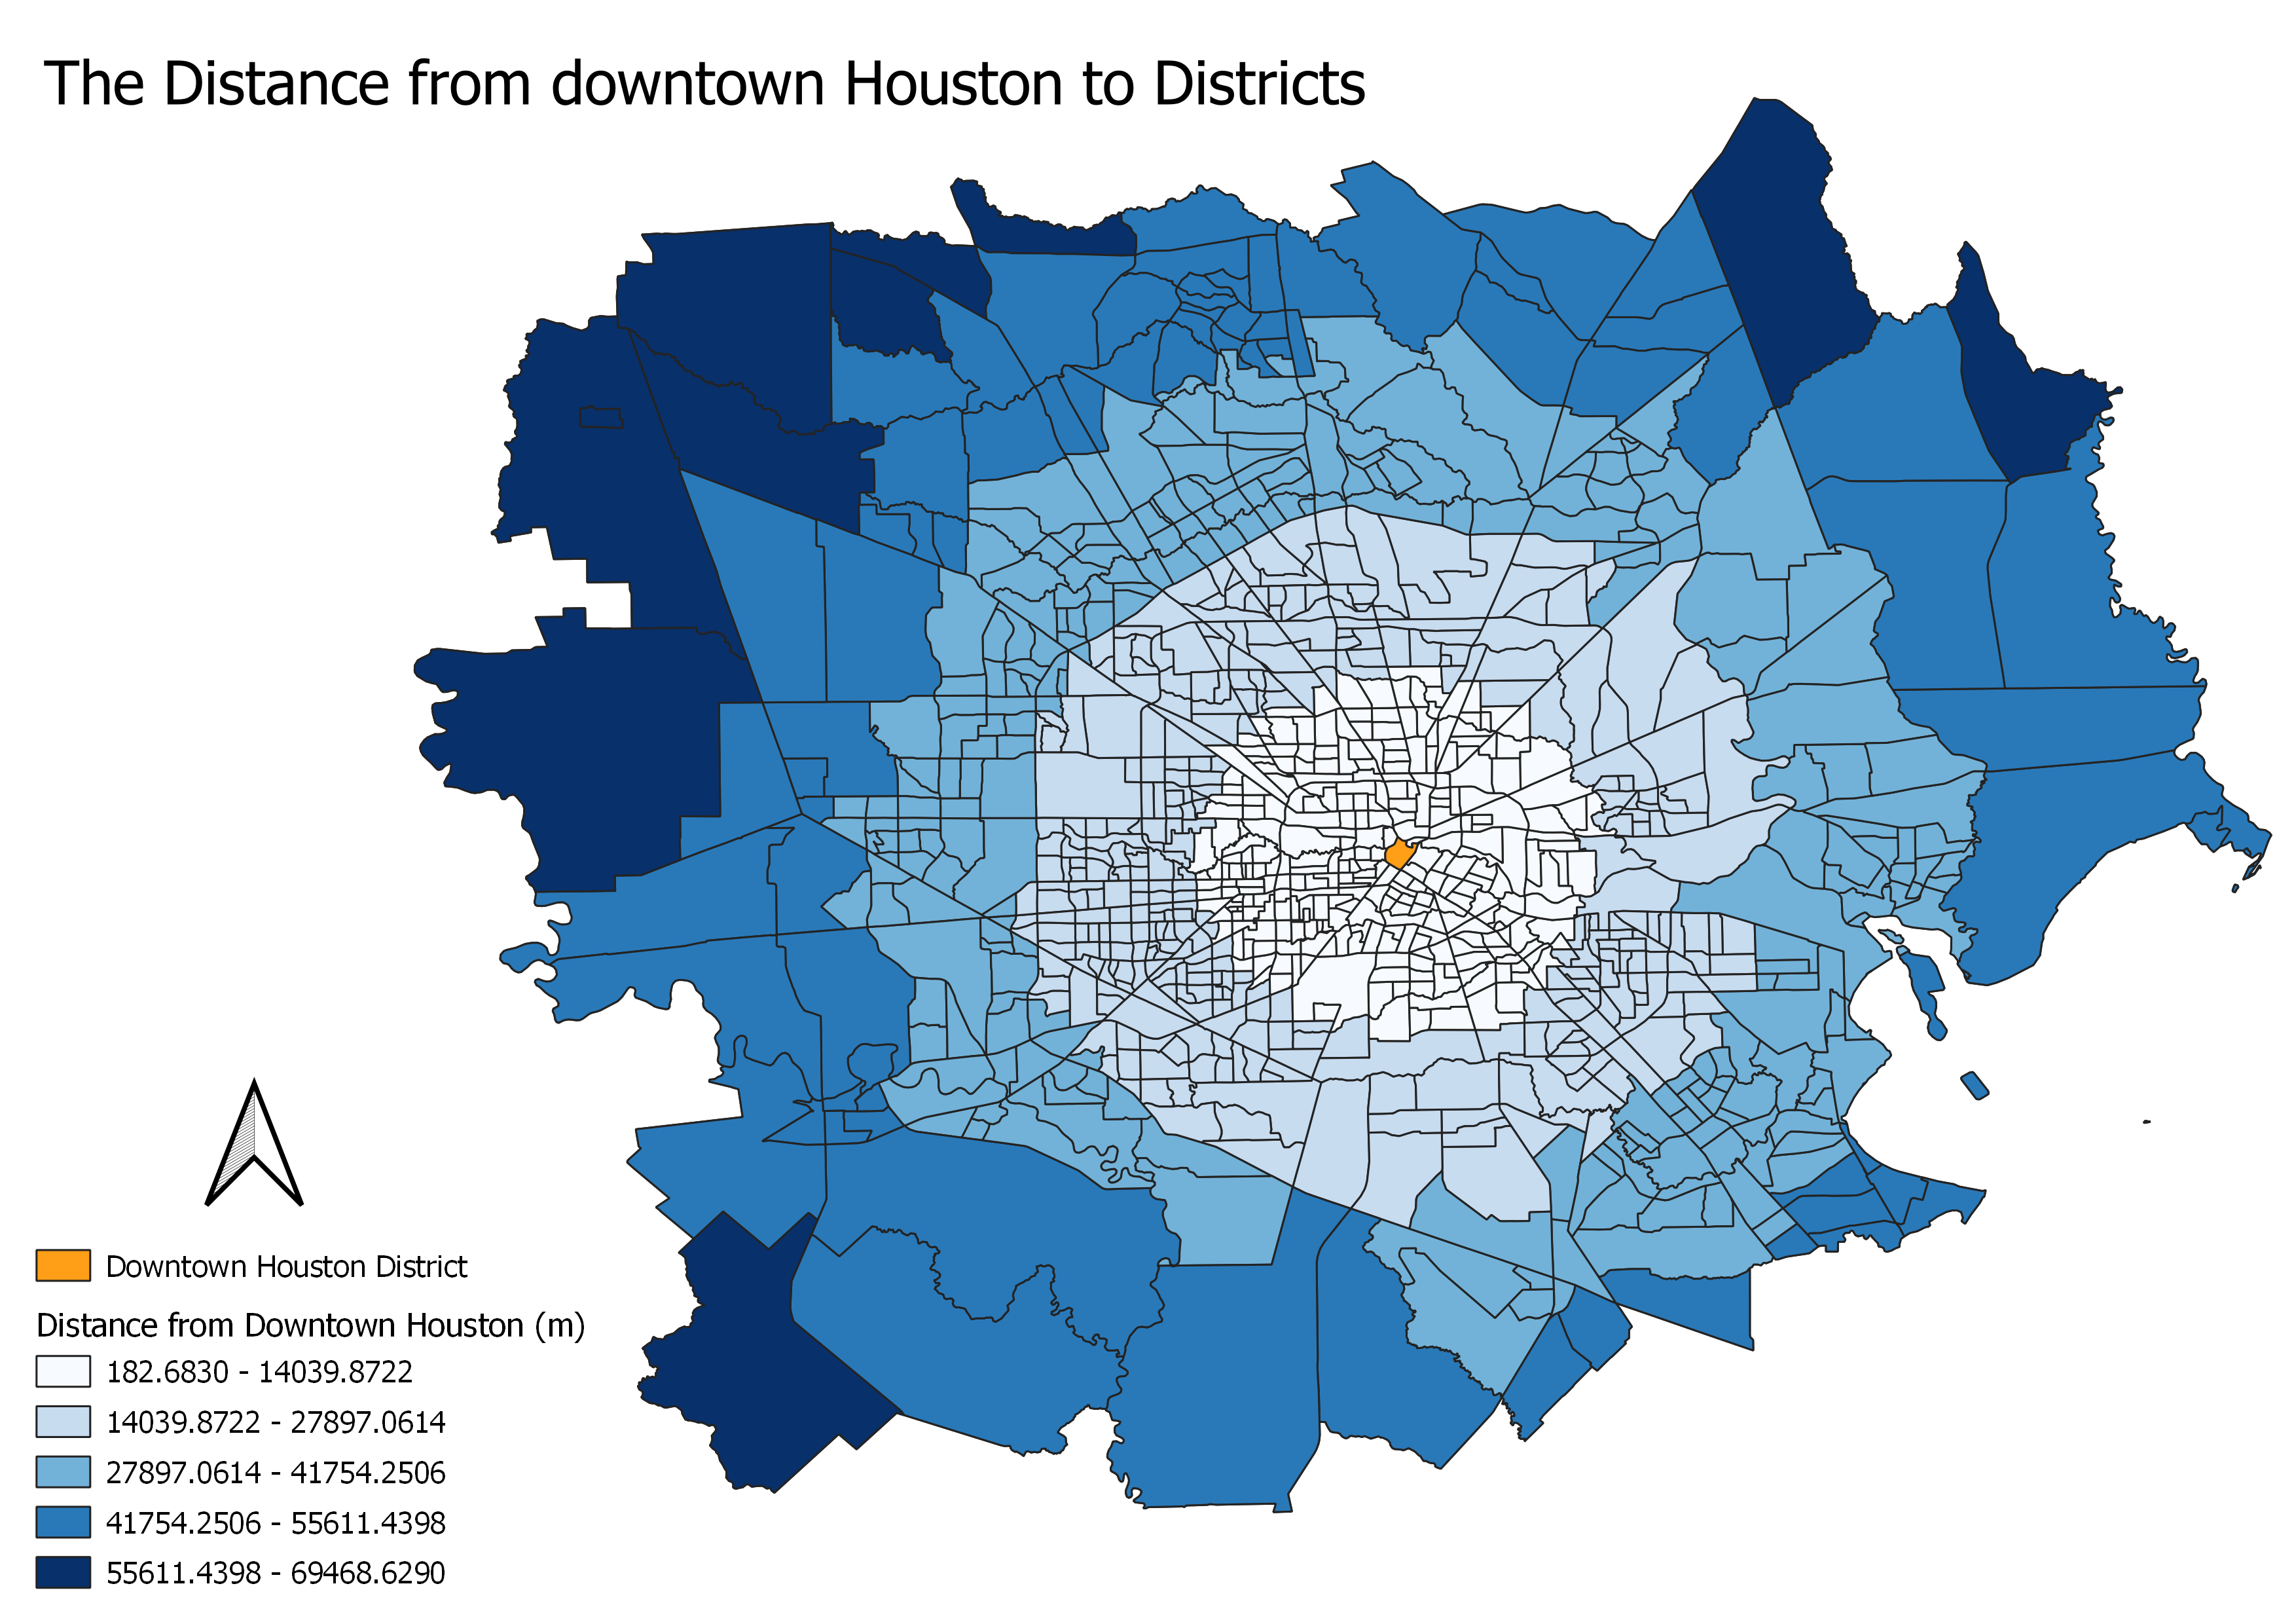
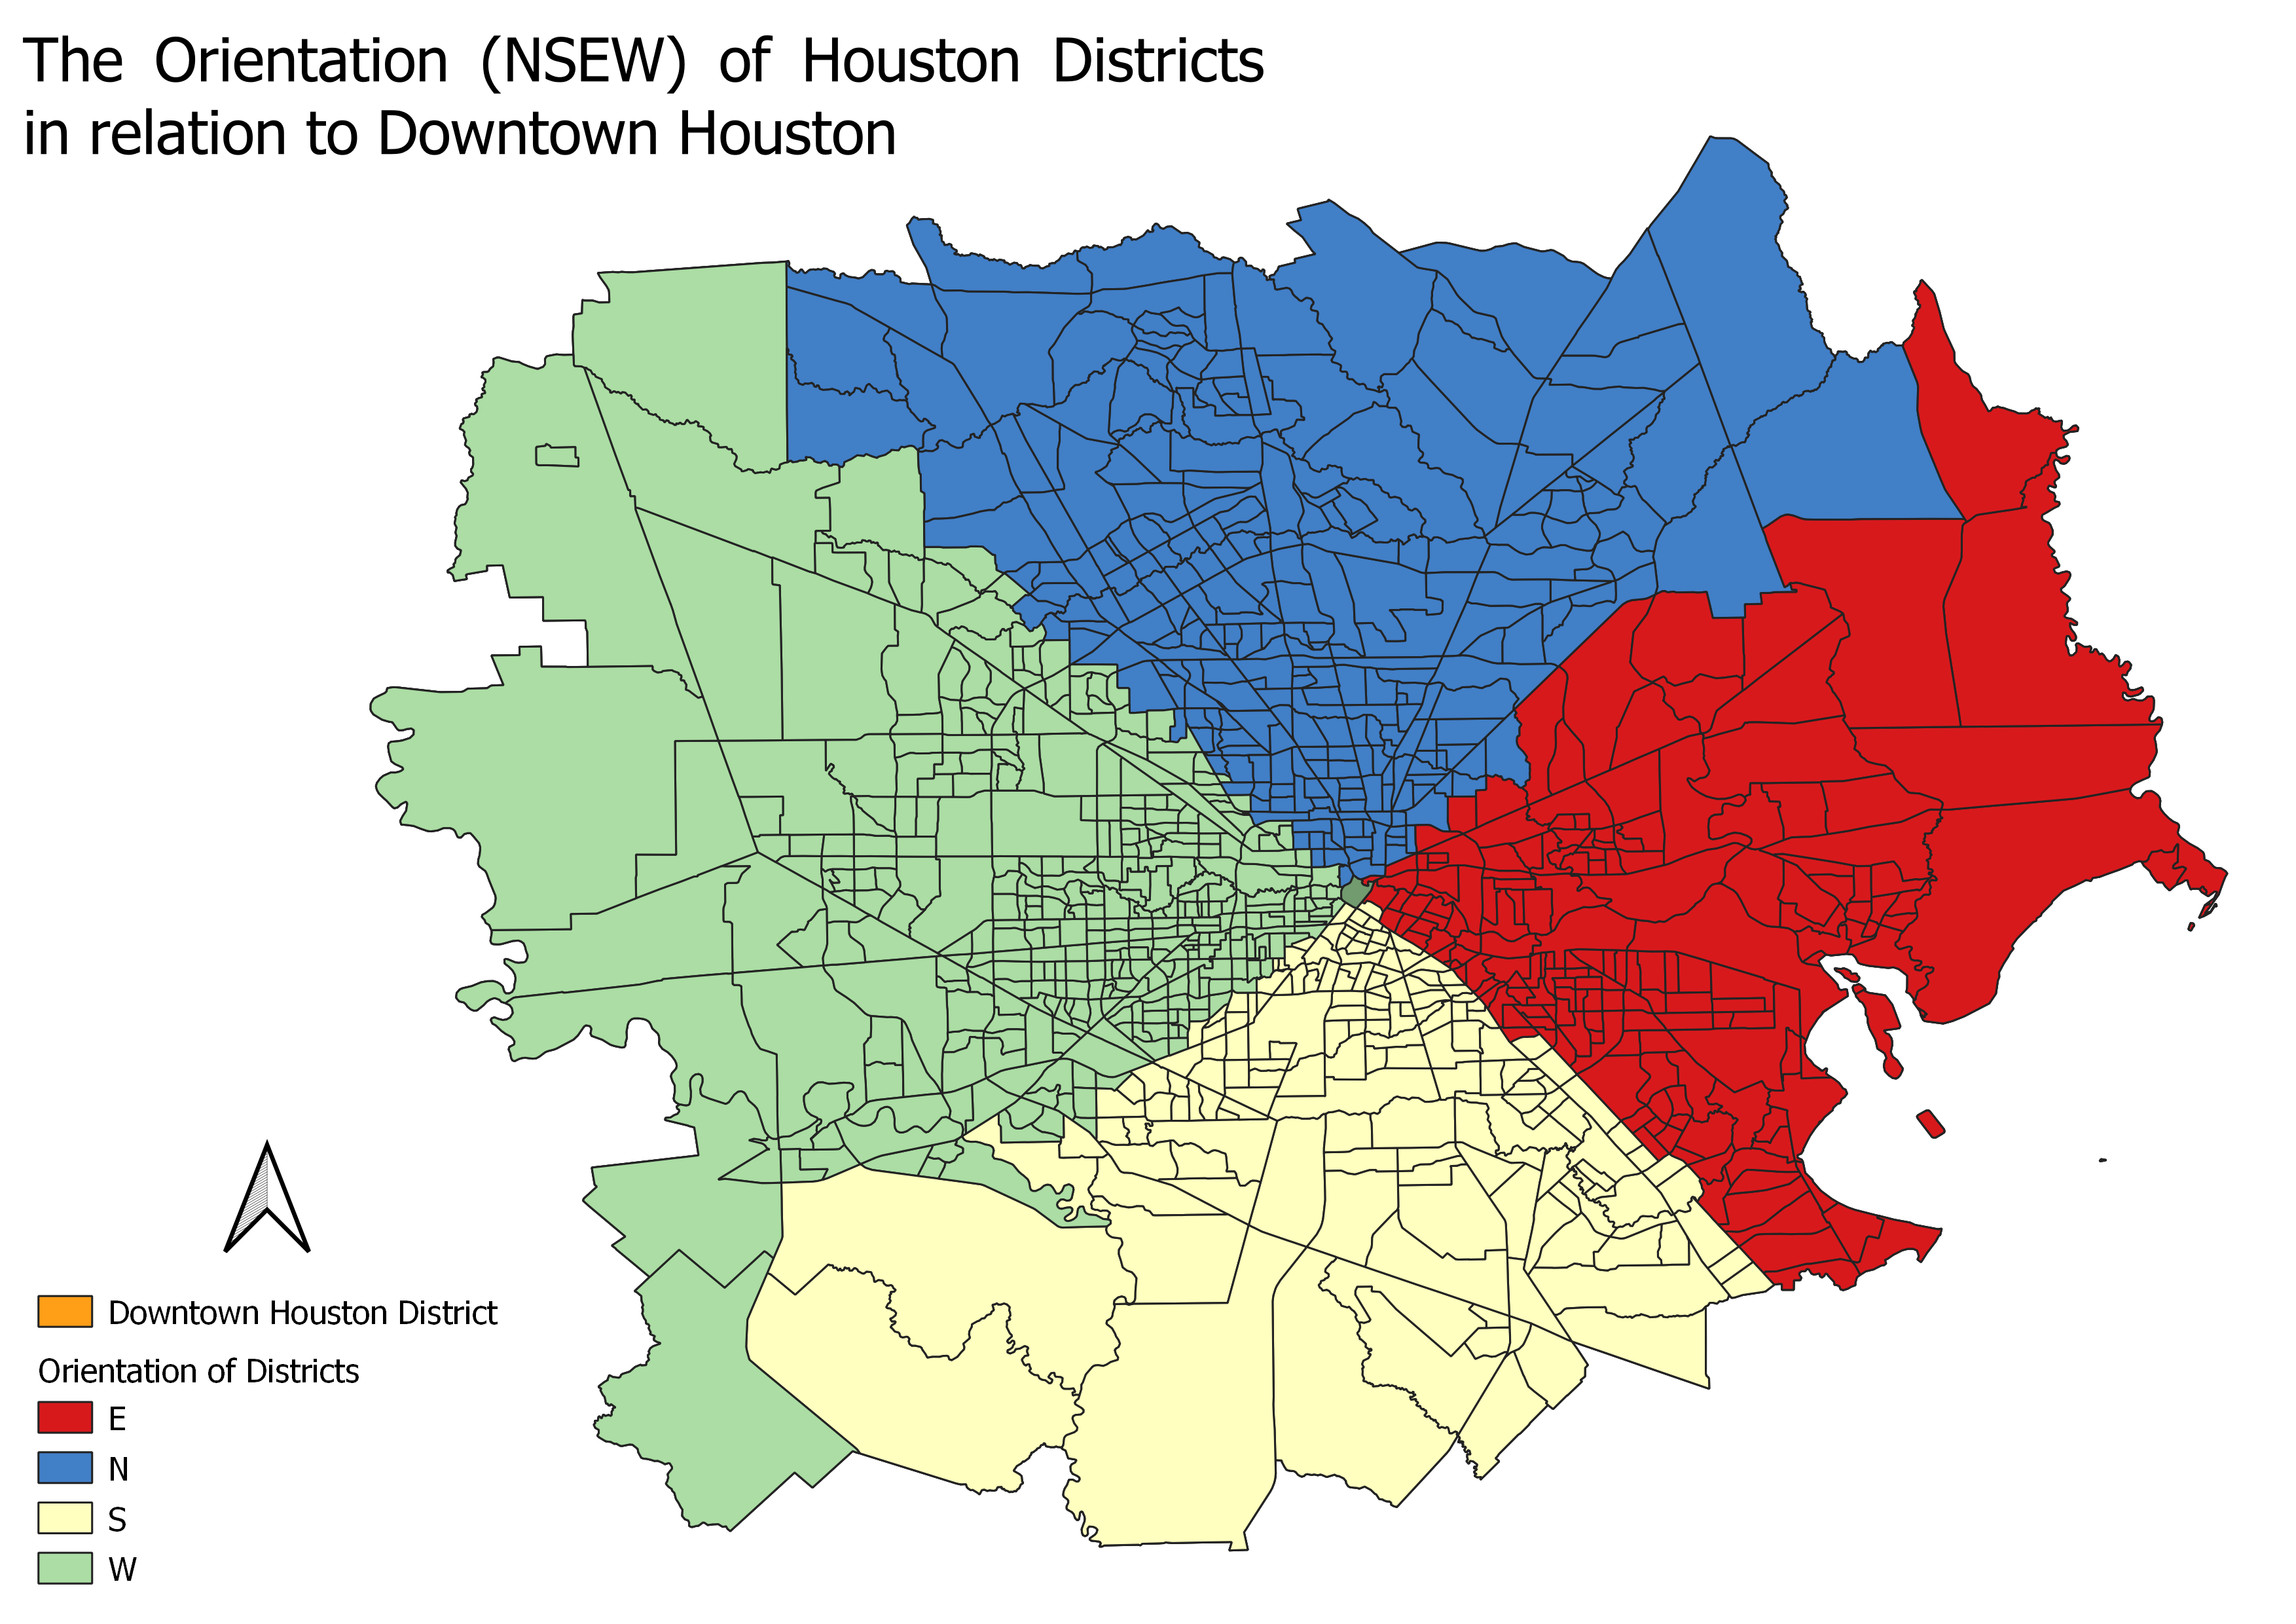
In my model, I used the downtown Houston district as my ‘City Center’ from which the model would measure the distance, direction, and NSEW orientation of the districts. My ‘Input features’ were the greater Houston area districts. The results from the model can be seen in the maps below. The first map gives a visual representation of the distances to the districts measured from downtown Houston, and the second map gives a visual representation of the NSEW orientation of the districts in relation to downtown Houston.
I used the direction data from my model to create a polar plot comparing the direction of a district relative to downtown Houston to the median gross rent of that district. On this graph, 0 degrees = N, 90 degrees = E, 180 degrees = S, 270 degrees = W. The higher median gross rents tend to fall on the W/NW side of the city.
Click on this plot to see this information graphed with DataPlotly.
When applied to a metropolitan area, this model allows the user to analyze census data. After analyzing the data with this model, the user can draw conclusions from this data and disseminate the new data and conclusions. The creation of this model, the analysis of data, and the future drawing of conclusions illustrates the “Ambiguity of GIS as ‘Tool’ versus ‘Science’” Wright et al. delves into in their 2010 article. Wright et al. explains that the three primary ways in which GIS is perceived are GIS as a toolmaking platform, GIS as a tool, and GIS as a science. In this instance, QGIS allowed for the creation of a tool (the model), the use of the model and GIS as a tool to analyze the data and visually display the data, and then finally ‘doing science’ by making conclusions from this new data with QGIS functions used to visually portray those conclusions.
As the Wright et al. article concludes, and the use of GIS here can be framed to support, GIS can be seen as a ‘continua’ between the classifications of tool, tool maker, and science. One of the cons to GIS is that anyone, especially with the development of opensource GIS, can become a ‘scientist,’ easily processing, analyzing, and drawing conclusions from data. The fear is that without the baseline geographic theories to contextualize the data analysis and conclusions, data can be easily misinterpreted or skewed. This may not be a misguided fear. In “The Discourse and Discipline of GIS,” Martin and Wing see many of their students view GIS as “positivist, quantitative, and based on a Cartesian spatial logic” (236). A viewpoint that separates GIS practice from ‘human geography’ practice. The theories and techniques learned from studying geography are no longer a necessary backbone ‘to do’ geography because of GIS.
In fact, I am the perfect example of the human geographer’s nightmare! I have no background in geography, I have only ever used GIS as a tool for geologic application, but I can take a course, learn about modeling, and apply that GIS knowledge to create a model that works with social data instead of rock data. I will need to think critically about how I apply my GIS modeling to draw geographic conclusions in the future!